


In this article I am going to discuss about the Best Protocol Analysis Tools such as Token Terminal that helps investors, researchers, and crypto enthusiasts to analyze blockchain protocols, track on-chain data, and evaluate project performance.
We will go through the most popular platforms like DeFiLlama, Artemis, Dune Analytics, Messari, Glassnode, Nansen and other tools of utmost importance for crypto research and discuss their most important features, advantages and limitations.
Key Points & Best Protocol Analysis Tools like Token Terminal
| Protocol Analysis Tool | Explanation |
|---|---|
| DeFiLlama | Tracks total value locked, yields, fees, revenue, and liquidity across DeFi protocols. |
| Artemis | Analyzes blockchain activity, active users, transactions, stablecoins, and network performance metrics. |
| Crypto Fees | Compares blockchain transaction fees, helping evaluate network costs and economic activity efficiently. |
| Dune Analytics | Creates customizable blockchain dashboards using SQL queries to analyze on-chain data and trends. |
| Messari | Provides crypto research, project fundamentals, token metrics, governance insights, and market intelligence. |
| Glassnode | Analyzes on-chain indicators, investor behavior, exchange flows, and cryptocurrency market cycles. |
| Nansen | Tracks wallet activity, smart money movements, token holdings, and blockchain investor behavior. |
| Tokenomist | Monitors token unlock schedules, vesting allocations, circulating supply changes, and potential selling pressure. |
| Footprint Analytics | Provides blockchain analytics dashboards for tracking users, transactions, DeFi performance, and ecosystem growth. |
| RWA.xyz | Tracks real-world asset tokenization, including tokenized treasuries, private credit, and asset distribution. |
10 Best Protocol Analysis Tools like Token Terminal
1. DeFiLlama
DeFiLlama is a popular analytical platform for analyzing decentralized finance protocols on multiple blockchain networks. It tracks total value locked (TVL) which is the value of assets deposited into supported protocols, and decentralized exchange trading volumes, fees, revenue, stablecoin supply, and yield opportunities.
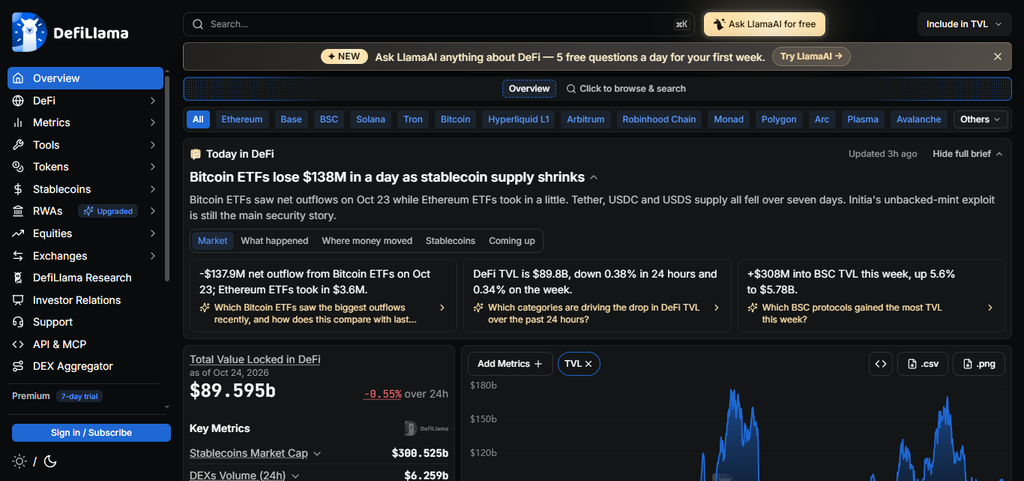
Analysts can then compare the protocols and chains to see the growth of the ecosystem, liquidity trends, and how they compare competitively. Its dashboards and APIs allow for research, reporting and data-driven monitoring. DeFiLlama is especially helpful when discovering new DeFi projects and comparing market share, but TVL alone does not indicate profitability or long-term viability.
DeFiLlama Pros & Cons
| Pros | Cons |
|---|---|
| Provides extensive DeFi TVL data across multiple blockchain networks. | TVL alone cannot measure protocol profitability or sustainability. |
| Tracks protocol fees, revenue, yields, and decentralized exchange volumes. | Data coverage and metric definitions vary between protocols. |
| Offers free dashboards for comparing DeFi ecosystems and applications. | Complex dashboards may overwhelm beginners. |
| Helps identify growing protocols and changing liquidity trends. | TVL can be inflated by leveraged positions or double-counted assets. |
| Provides APIs and historical data for research and analysis. | Less focused on detailed wallet-level investor behavior. |
2. Artemis
Artemis is a blockchain analytics platform that allows investors, researchers and crypto businesses to assess the fundamental performance of blockchain networks and applications. It pulls on-chain data and puts it into comparable metrics for user activity, transaction counts, app usage, stablecoin activity, fees and revenue.

Its Terminal offers dashboards for ecosystem comparisons and data tools for spreadsheet-based research and programmatic analysis. Analysts can use Artemis to see if a network is growing because of real adoption, not short term speculation. It is especially helpful when comparing competing blockchains and for identifying which applications contribute to ecosystem activity.
Artemis Pros & Cons
| Pros | Cons |
|---|---|
| Enables comparisons of blockchain fundamentals and network performance. | Some advanced datasets and features may require paid access. |
| Tracks active users, transactions, stablecoins, and economic activity. | Different chains may define activity metrics differently. |
| Helps assess adoption across competing blockchain ecosystems. | Raw transaction counts do not necessarily indicate meaningful usage. |
| Provides dashboards and data tools for analysts and investors. | Coverage and historical depth vary across networks. |
| Supports data-driven ecosystem research and performance monitoring. | Requires additional context to evaluate protocol profitability. |
3. Crypto Fees
Crypto Fees is a good place to see the fees charged by crypto networks and decentralized applications. The data on fees allows analysts to see how much users pay to access services like decentralized exchanges, lending platforms and blockchain infrastructure. By comparing the fee generation of the protocols, one can identify which applications are able to attract a sustained demand and monetize their activity effectively.
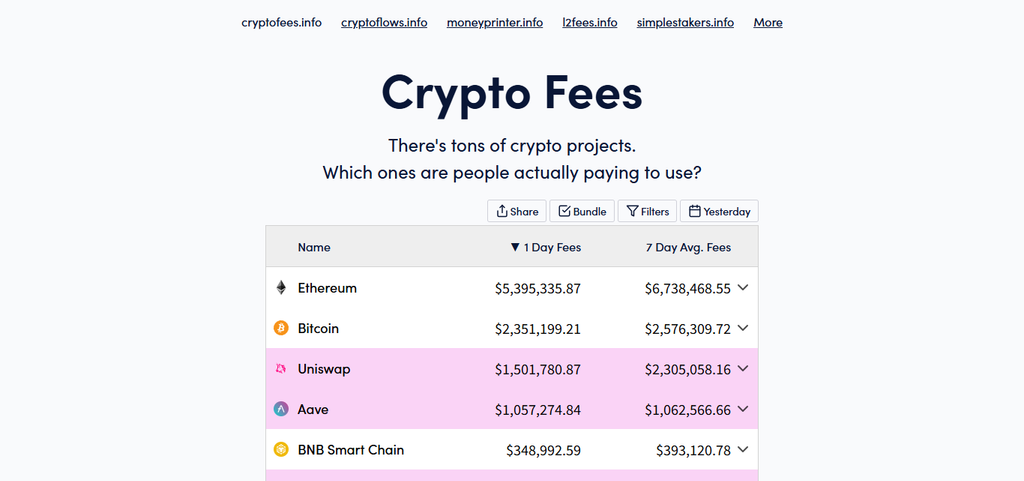
Researchers could also examine historical trends to distinguish between short-term spikes and steady use. But fees don’t necessarily equal protocol revenue or token-holder earnings, since some payments go to validators, liquidity providers, or other participants. Always check how the platform defines its metrics and what they cover before you compare.
Crypto Fees Pros & Cons
| Pros | Cons |
|---|---|
| Makes it easy to compare fees generated by blockchain protocols. | Focuses primarily on fees rather than comprehensive protocol fundamentals. |
| Helps identify applications generating substantial transaction-related activity. | Fee rankings can change significantly during market volatility. |
| Provides a straightforward way to monitor fee trends. | Fees do not always equal revenue retained by the protocol. |
| Useful for comparing monetization across selected applications. | Available protocol coverage may be narrower than larger analytics platforms. |
| Helps researchers identify periods of increased network demand. | Limited context about user retention, tokenomics, and profitability. |
4. Dune Analytics
Dune Analytics is a powerful blockchain data platform that lets users query on-chain data and turn it into interactive dashboards. Analysts can explore wallet transactions, token transfers, decentralized exchange activity, protocol usage, and smart contract events in its SQL-like environment.
Users can create custom metrics for projects that do not have analytics built in or adapt queries created by the community to answer specific research questions. Dune is especially useful for observing protocol adoption, monitoring user retention and analyzing transaction trends across supported networks. While flexibility is a big advantage, you need good queries, data validation and an understanding of blockchain structures to get reliable results.
Dune Analytics Pros & Cons
| Pros | Cons |
|---|---|
| Enables highly customizable blockchain dashboards and visualizations. | Requires SQL knowledge for advanced queries and custom analysis. |
| Supports detailed analysis of transactions, wallets, and smart contracts. | Incorrect queries can produce misleading results. |
| Provides community-created dashboards that accelerate research. | Community dashboards may contain outdated assumptions or errors. |
| Helps investigate specific protocols beyond standard analytics metrics. | Complex queries can require time and computational resources. |
| Supports sharing research and collaborating through dashboards. | Data availability and query support vary by blockchain. |
5. Messari
Messari is a crypto research and data platform that helps investors understand blockchain projects, digital currencies, and market developments. Research resources cover project fundamentals, sector trends, token metrics, governance, fundraising, and competitive landscapes. Analysts can study the working of protocols, analyze their positioning in the market and spot developments that are relevant to their ecosystems.
Messari also has data exploration and screening capabilities that allow for comparisons of assets and networks. It can be especially handy when doing investment due diligence and researchers need context beyond price charts and on-chain stats. Users should differentiate factual reporting from analytical opinions and perform their own due diligence on key investment assumptions.
Messari Pros & Cons
| Pros | Cons |
|---|---|
| Provides structured crypto research and project fundamentals. | Many premium research features require paid subscriptions. |
| Helps evaluate token utility, governance, and competitive positioning. | Research coverage and update frequency vary between projects. |
| Offers market intelligence and sector-level analysis. | Some research depends on assumptions or analyst interpretation. |
| Useful for investment due diligence and industry research. | Less specialized in real-time wallet-level tracking than Nansen. |
| Combines project information with broader market context. | Users should independently verify important investment claims. |
6. Glassnode
Glassnode is a specialist in blockchain intelligence and on-chain financial metrics that help analysts understand the behavior of the cryptocurrency market. Its datasets comprise network activity, wallet growth, circulating supply, exchange flows, investor profitability, and realized or unrealized gains and losses. These indicators can help researchers assess whether investors are accumulating assets, distributing holdings or responding to changing market conditions.
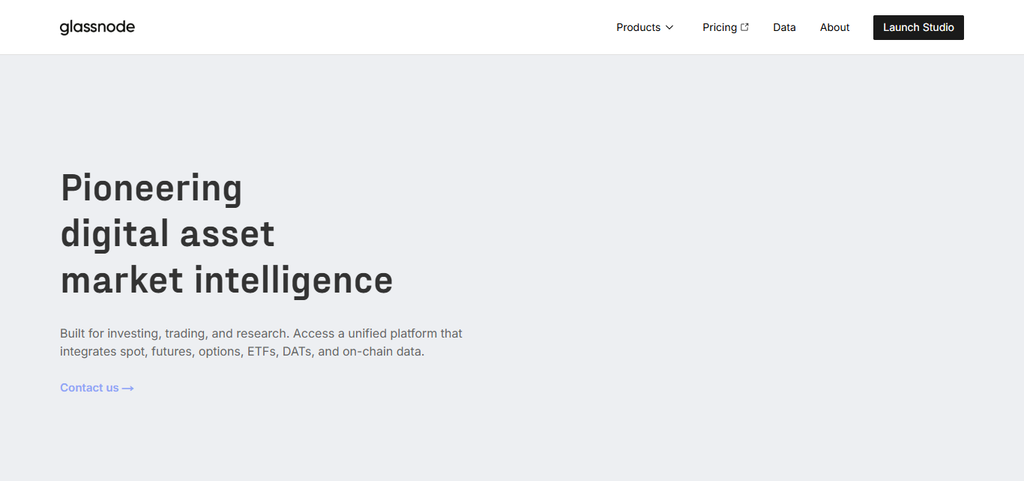
Glassnode is especially helpful in Bitcoin and Ethereum market-cycle analysis, as historical on-chain patterns provide an extra layer of context to price movements. Its charts and research tools are built for both short-term monitoring and long-term analysis. But past relationships do not guaranty future market performance.
Glassnode Pros & Cons
| Pros | Cons |
|---|---|
| Offers extensive on-chain indicators for major cryptocurrencies. | Advanced analytics and datasets may require paid plans. |
| Helps analyze investor behavior, exchange flows, and supply dynamics. | Some metrics are difficult for beginners to interpret. |
| Provides historical data for studying market cycles. | Historical patterns do not reliably predict future prices. |
| Supports research into realized profits, losses, and accumulation. | Coverage varies across assets and blockchain networks. |
| Offers charts and research for market monitoring. | On-chain indicators alone cannot explain every market movement. |
7. Nansen
Nansen is an on-chain intelligence platform that enables users to investigate wallet activity and follow the movements of experienced traders, funds and large cryptocurrency holders. Its wallet labeling ability helps associate blockchain addresses with identifiable individuals or behavioral categories, which makes transaction analysis easier.
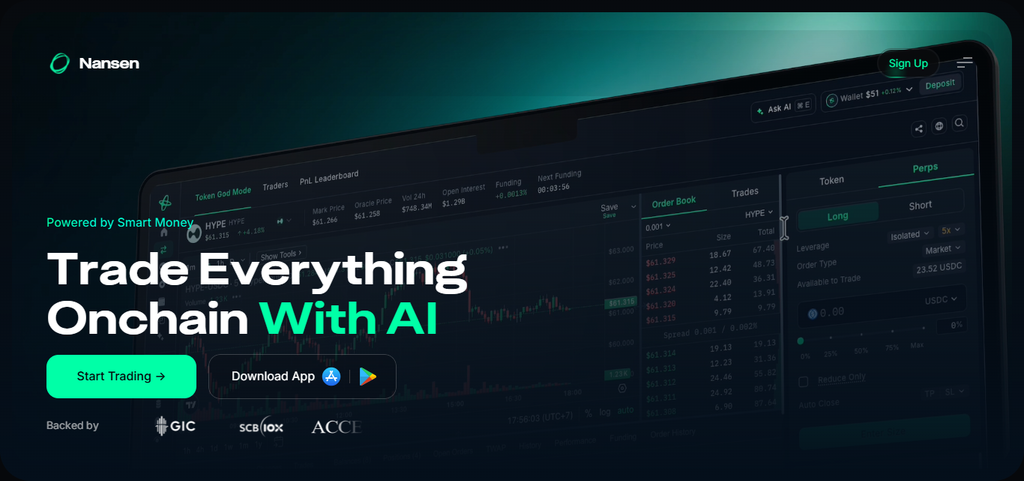
Users can evaluate token holdings, wallet performance, exchange flows and trading activity to identify potential market trends. Nansen is especially helpful when conducting research on token launches, large-holder behavior, and the flow of capital between assets and networks. Wallet labels and historical performance do not guaranty future success, and individual transactions should be carefully interpreted in context.
Nansen Pros & Cons
| Pros | Cons |
|---|---|
| Labels wallets to make blockchain activity easier to interpret. | Wallet labels may be incomplete or occasionally inaccurate. |
| Tracks smart money movements and large-holder transactions. | Following successful wallets does not guarantee profitable results. |
| Helps investigate token holders and trading behavior. | Advanced features and analytics can be expensive. |
| Supports research into token launches and capital movements. | Wallet activity can be difficult to interpret without context. |
| Provides actionable insights into selected blockchain ecosystems. | Coverage and labeling quality differ across networks. |
8. Tokenomist
Tokenomist is a tokenomics analytics platform to help investors understand how the cryptocurrency supply changes over time. It monitors for scheduled token unlocks, vesting, allocations and future releases that could add to circulating supply. These insights are important when evaluating projects with tokens assigned to founding teams, early investors, foundations, or ecosystem incentives.
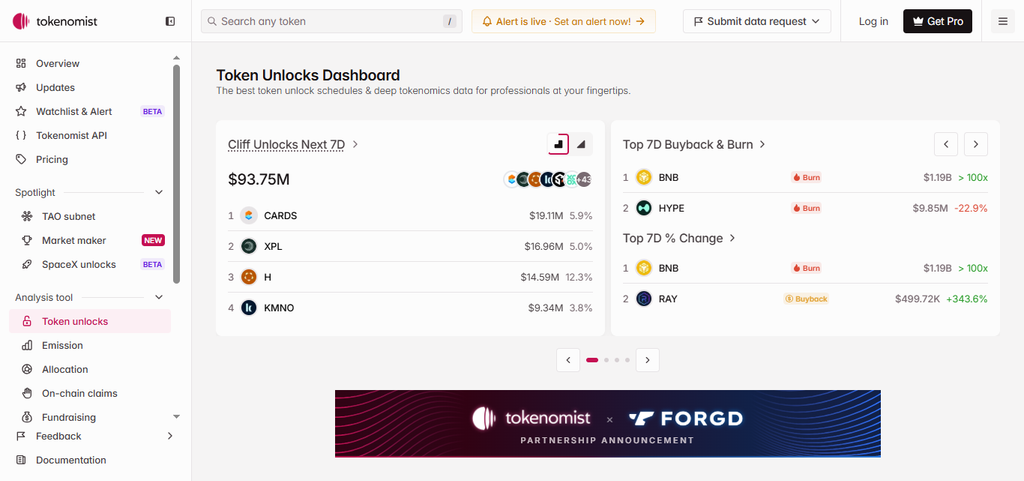
By comparing upcoming unlocks to circulating supply and market liquidity, analysts can evaluate potential dilution and selling-pressure risks. Tokenomist also provides data for token emissions and buybacks. But an unlock does not necessarily lead to a sell-off of tokens or a price drop.
Tokenomist Pros & Cons
| Pros | Cons |
|---|---|
| Tracks upcoming token unlocks and vesting schedules. | Unlock schedules may change when projects revise their plans. |
| Helps evaluate dilution risk and circulating supply growth. | Unlocks do not necessarily result in immediate selling pressure. |
| Identifies allocations associated with teams and early investors. | Allocation data may be incomplete for certain projects. |
| Supports research into token emissions and supply dynamics. | Does not independently establish a token’s fair market value. |
| Helps investors prepare for important tokenomics events. | Supply analysis must be combined with liquidity and demand data. |
9. Analytics
Footprint Analytics is a blockchain data and analytics platform that simplifies the exploration, visualization, and understanding of on-chain data. Its analytics capabilities enable research into blockchain ecosystems, decentralized applications, gaming projects, and DeFi activity.

Users can evaluate transaction patterns, user engagement, asset movements and project growth using structured datasets and visual dashboards. Protocol teams can use these findings to measure adoption, identify usage trends, and compare performance across applications or networks.
Analysts may also develop bespoke indicators for specific research aims depending on the available data sets. Before drawing conclusions from comparisons, one needs to check the data coverage and the metric definitions.
Footprint Analytics Pros & Cons
| Pros | Cons |
|---|---|
| Provides visual dashboards for exploring blockchain activity. | Coverage and data depth vary across ecosystems. |
| Supports research into DeFi, gaming, and application usage. | Some advanced analysis requires data and query familiarity. |
| Helps monitor transaction trends and ecosystem growth. | Dashboard metrics may require additional validation. |
| Makes blockchain data easier to explore visually. | Specialized financial metrics may be less comprehensive than dedicated platforms. |
| Supports customized analysis for selected research objectives. | Available datasets and features can change over time. |
10. RWA.xyz
RWA.xyz is a data analytics platform focused on tokenized real-world assets (RWAs) on blockchain networks. It helps users discover tokenized financial products from government securities, to private credit, commodities and other asset classes.
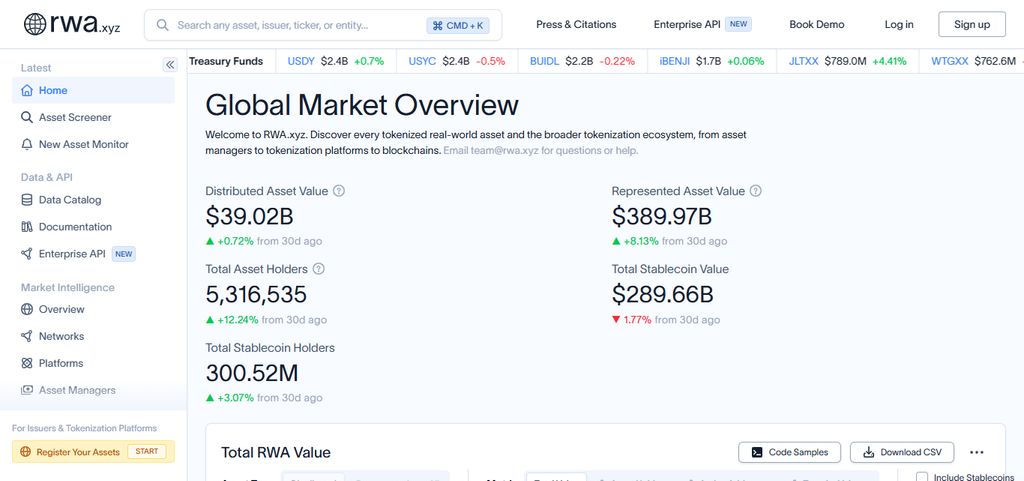
Its dashboards provide insight into asset values, issuers, investor participation, and blockchain distribution, allowing analysts to better understand the evolution of tokenized financial markets. Investors and researchers can then compare asset categories, look at market concentration, and see which networks are supporting growing tokenization activity.
RWA.xyz is especially useful for tracing the link between traditional finance and blockchain infrastructure. But an asset’s legal rights, liquidity, or creditworthiness are not defined only by its on-chain representation.
RWA.xyz Pros & Cons
| Pros | Cons |
|---|---|
| Specializes in tokenized real-world asset market analytics. | Focuses on RWAs rather than the entire crypto ecosystem. |
| Tracks categories such as tokenized treasuries and private credit. | Asset coverage varies by category and issuer. |
| Helps compare issuers, networks, and tokenized asset markets. | Reported values may not represent immediately available liquidity. |
| Provides useful insights into tokenization adoption and market growth. | On-chain data cannot fully capture legal and credit risks. |
| Helps researchers understand connections between traditional finance and blockchain. | Comparisons can be complicated by differing asset structures and reporting methods. |
Conclusion
To summarize, Best Protocol Analysis Tools such as Token Terminal help investors and researchers analyze blockchain performance, monitor on-chain activity, study tokenomics, and understand protocol revenue. Platforms like DeFiLlama, Artemis
Dune Analytics, Messari and Nansen can provide useful insights depending on your research needs. By combining these tools, users are able to make decisions with greater knowledge, identify emerging opportunities and gain a better understanding of the evolving cryptocurrency ecosystem.
FAQ
They analyze blockchain data, protocol revenue, user activity, and financial performance.
DeFiLlama provides useful TVL, liquidity, and fee metrics.
It offers free features and paid options.
Blockchain adoption and network fundamentals.
Tokenomist monitors vesting schedules.