

In this article, I will discuss the best protocol analysis tools like Token Terminal that help investors, researchers, and crypto enthusiasts analyze blockchain protocols.
These tools provide valuable insights into protocol revenue, transaction fees, total value locked (TVL), user activity, tokenomics, and market trends. Discover the top platforms for evaluating crypto projects, tracking on-chain data, and making informed investment decisions.
Key Points & Best Protocol Analysis Tools like Token Terminal
| Tool | Explanation |
|---|---|
| DeFiLlama | Tracks DeFi TVL, protocol revenue, fees, yields, and liquidity across blockchains. |
| Artemis | Analyzes blockchain activity, active users, transactions, and ecosystem growth through data dashboards. |
| Crypto Fees | Compares blockchain and protocol fees to identify revenue trends and network usage patterns. |
| Dune Analytics | Creates customizable blockchain dashboards using SQL queries to analyze on-chain data and metrics. |
| Messari | Provides crypto research, protocol fundamentals, market intelligence, and detailed project analysis for investors. |
| Token Unlocks | Tracks upcoming token unlocks, vesting schedules, circulating supply changes, and potential selling pressure. |
| Nansen | Offers wallet labeling, smart money tracking, and on-chain analytics to identify investor activity. |
| Glassnode | Delivers on-chain metrics, market indicators, and investor behavior insights for cryptocurrency market analysis. |
| Coin Metrics | Provides institutional-grade blockchain data, network metrics, and market indicators for fundamental crypto research. |
| Santiment | Combines on-chain, social, and development data to evaluate crypto projects and market sentiment. |
10 Best Protocol Analysis Tools like Token Terminal
1. DeFiLlama
Token Terminal is one of the best protocol analytics applications to track decentralized finance projects across multiple blockchain networks, such as DeFiLlama. It provides data on total value locked (TVL), protocol fees, revenue, stablecoins, yields and decentralized exchange activity. Users will be able to see DeFi protocol comparisons, liquidity changes and ecosystem growth.
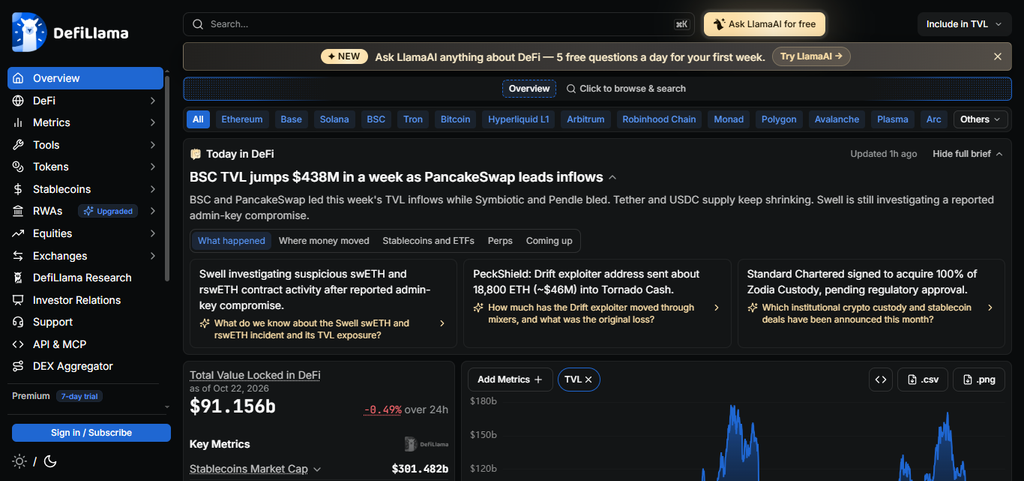
Its dashboards simplify the analysis of the adoption and financial activity of a project without the need to manually collect blockchain data. DeFiLlama also provides open source analytics and blockchain data for researchers and developers. The financial metrics are not standardized like Token Terminal, but it is very useful to understand DeFi liquidity, protocol performance and market trends.
DeFiLlama Features
| Feature | Explanation |
|---|---|
| TVL Tracking | Monitors total value locked across DeFi protocols and blockchains. |
| Fee Analytics | Tracks protocol fees and revenue to evaluate financial activity. |
| Yield Tracking | Compares yields across decentralized finance platforms and liquidity pools. |
| Stablecoin Analytics | Tracks stablecoin supply and distribution across supported blockchain networks. |
2. Artemis
Artemis is a blockchain analytics platform that enables users to analyze network activity and ecosystem health with comparable on-chain metrics. Depending on the network and dataset, it tracks indicators like daily active addresses, transactions, fees, stablecoin activity and developer ecosystem information.
These metrics allow researchers to compare blockchain adoption and track changes in user engagement over time. Artemis is especially helpful when seeing if the network’s growth is coming from activity, not just market speculation.
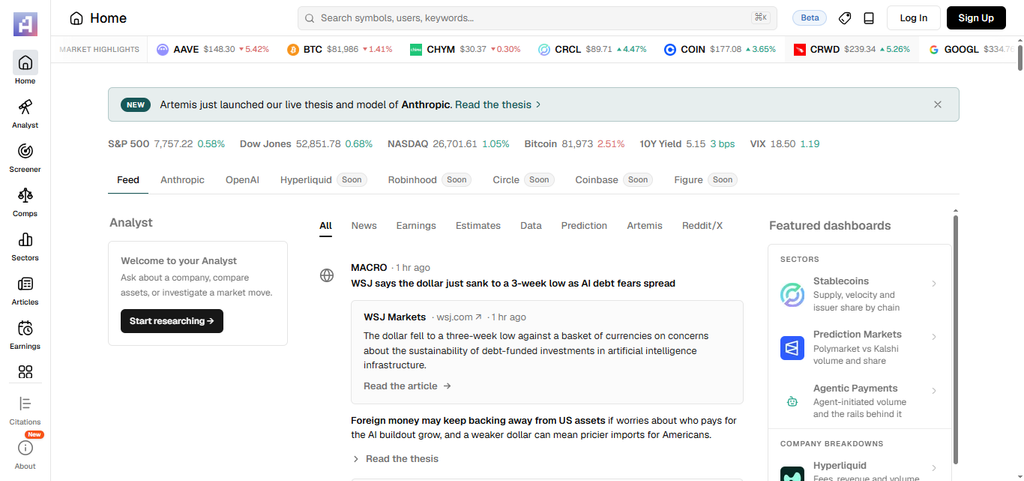
Compared to Token Terminal’s protocol financials and business-style metrics, Artemis provides a broader coverage of blockchain ecosystems. It’s an interesting choice for investors, analysts and developers researching on blockchain growth.
Artemis Features
| Feature | Explanation |
|---|---|
| Active Addresses | Measures user activity across supported blockchain networks. |
| Transaction Metrics | Tracks transaction volumes to evaluate blockchain usage and growth. |
| Ecosystem Comparison | Compares blockchain performance using standardized on-chain metrics. |
| Developer Activity | Provides ecosystem development indicators for evaluating blockchain growth. |
3. Crypto Fees
Crypto Fees is a helpful resource for comparing transaction fees generated by popular blockchain networks and decentralized applications. It provides users with visibility into the networks and protocols that are creating fees and how they evolve over time. Fee data can give clues on demand, network use and economic activity underpinning a blockchain ecosystem.
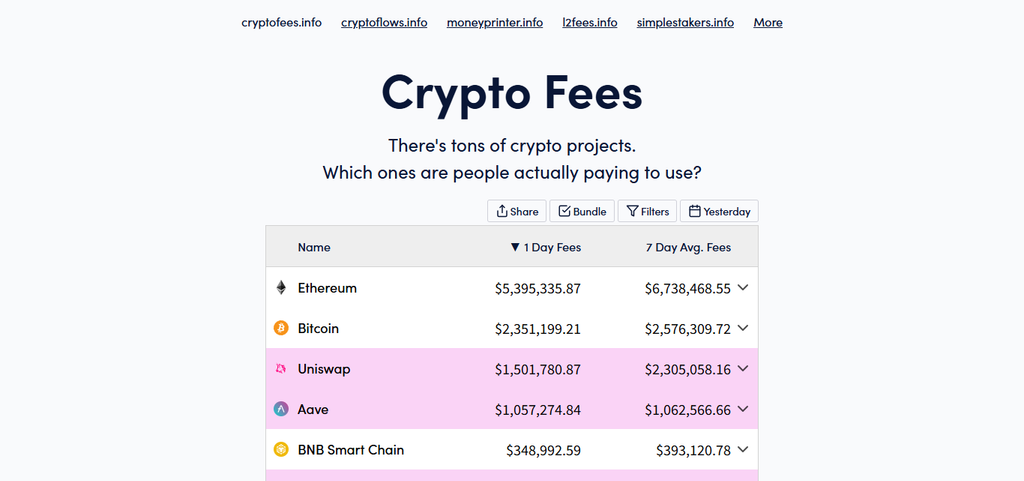
These insights can be used in conjunction with metrics like TVL, revenue, and active users to gain a more comprehensive picture of protocol performance. However, unlike Token Terminal, which offers more in-depth finance & operational analytics, Crypto Fees only focuses on fee generation. It’s a simple approach but can be handy for quick comparisons. But coverage and historical data available may differ.
Crypto Fees Features
| Feature | Explanation |
|---|---|
| Fee Rankings | Compares fees generated by supported blockchain networks and protocols. |
| Revenue Monitoring | Helps identify projects generating significant transaction-related fees. |
| Historical Trends | Examines changes in fee generation over time. |
| Network Comparison | Highlights differences in economic activity across supported blockchain ecosystems. |
4. Dune Analytics
Dune Analytics is one of the best Token Terminal-like protocol analytics programs for users seeking customizable blockchain research. It enables analysts to query supported blockchain datasets with SQL and turn the results into interactive dashboards, charts and tables. Researchers may evaluate token transfers, decentralized exchange transactions, wallet activity, protocol usage and other on-chain behaviors.
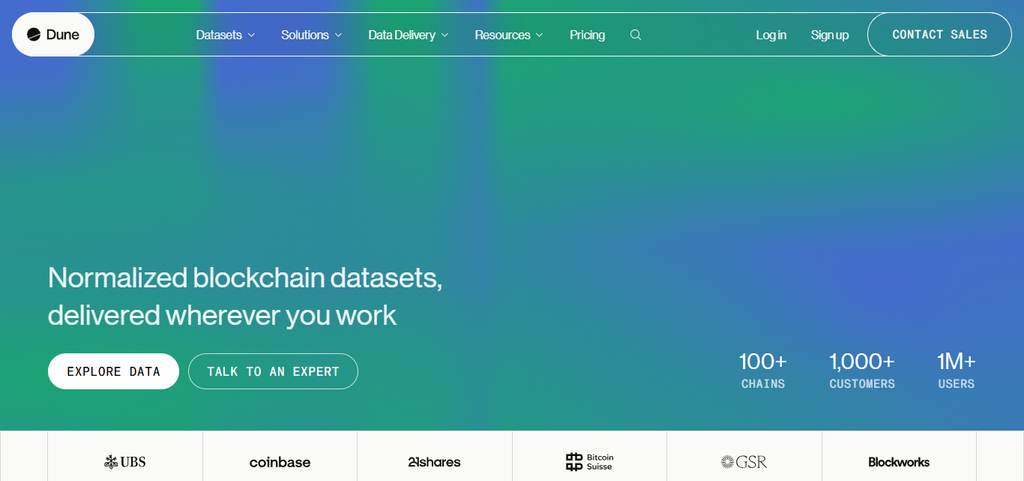
Members of the community can also create dashboards for users to explore and find insights, instead of having to build everything themselves. Dune provides more flexibility to answer some research questions than does Token Terminal’s standardized financial reporting. But the accuracy of such custom dashboards is subject to query design , data coverage , and interpretation . Therefore , technical knowledge can be useful for advanced analysis .
Dune Analytics Features
| Feature | Explanation |
|---|---|
| SQL Queries | Enables customized blockchain data analysis using SQL queries. |
| Interactive Dashboards | Presents on-chain insights through charts, tables, and visualizations. |
| Community Queries | Allows users to explore dashboards created by other analysts. |
| Multi-Chain Analytics | Analyzes supported blockchain datasets to investigate transactions and user activity. |
5. Messari
Messari is a crypto research and market intelligence platform that helps investors understand blockchain projects, tokenomics and protocol fundamentals. Depending on the product and subscription available, users can get access to project profiles, research reports, financial information, governance updates and market data.
These resources enable researchers to assess the business model, competitive position, development progress and potential risks of a protocol. Messari is particularly useful when you need to supplement quantitative metrics with qualitative research and industry context.
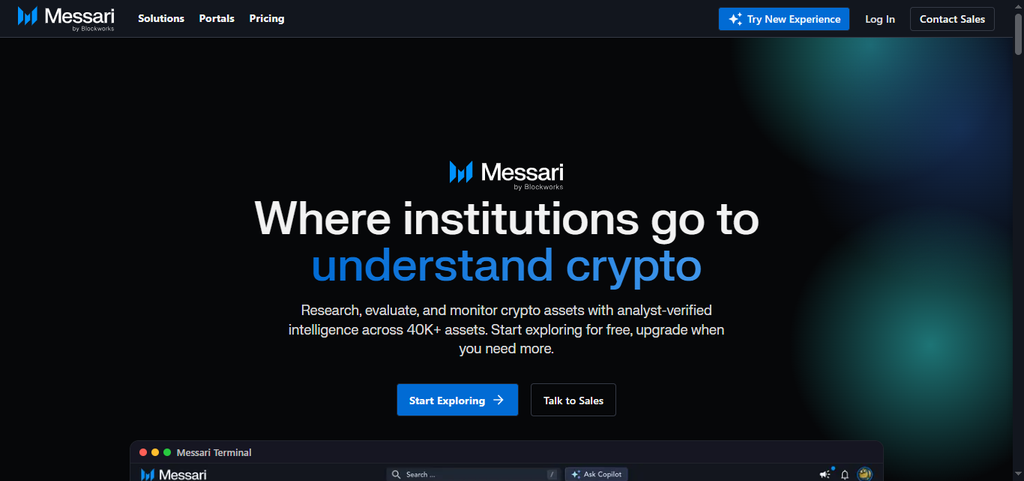
Messari offers a more research-oriented view, compared to Token Terminal’s focus on standardized protocol financials. Both platforms together can help users evaluate the numbers, the progress of projects, the competitive landscape, and the future opportunities.
Messari Features
| Feature | Explanation |
|---|---|
| Research Reports | Provides crypto research covering projects, markets, and blockchain ecosystems. |
| Project Profiles | Summarizes protocol fundamentals, token information, and project developments. |
| Financial Metrics | Offers available financial and market data for cryptocurrency analysis. |
| Governance Insights | Helps researchers follow protocol governance and important project updates. |
6. Token Unlocks
Token Unlocks is a specialized tool for tracking cryptocurrency vesting schedules and upcoming token releases, useful for assessing risks related to token supply. The platform enables users to identify when allocations for teams, investors, foundations and other stakeholders are due to be released.
Large unlock events could potentially increase the circulating supply and cause selling pressure, but their real market effect depends on demand, recipient behavior and wider conditions. Researchers can use these schedules to compare tokenomics across projects and prepare for major supply shifts.
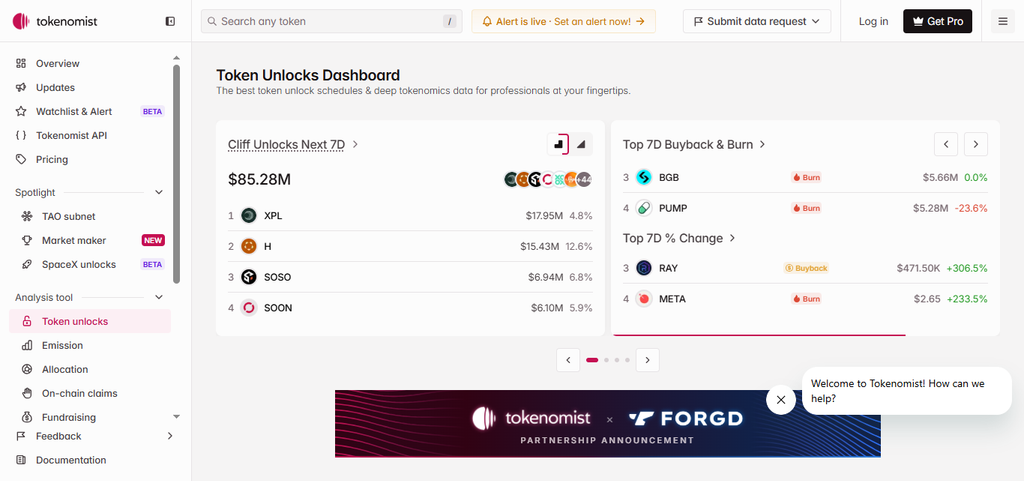
Unlike Token Terminal, which focuses on protocol financial performance, Token Unlocks centers on token distribution and supply dynamics, making it especially useful for assessing dilution risks and token investment fundamentals.
Token Unlocks Features
| Feature | Explanation |
|---|---|
| Unlock Calendar | Displays scheduled token unlock events for supported projects. |
| Vesting Schedules | Tracks token allocations and their planned release timelines. |
| Supply Analysis | Helps evaluate changes in circulating token supply. |
| Unlock Notifications | Supports monitoring upcoming unlock events where notification features are available. |
7. Nansen
Nansen is a blockchain analytics platform focused on wallet labeling, address tracking and smart money insights. This enables users to explore activity of specific wallets, track token flows, study participation in decentralized finance, and detect patterns in supported blockchain networks.
By identifying wallets linked to specific entities or trading strategies, investigators may obtain a deeper insight into the behavior of sophisticated investors in crypto markets. These insights may help to uncover emerging trends but wallet labels and observed transactions cannot be automatically taken as evidence for future price movements.
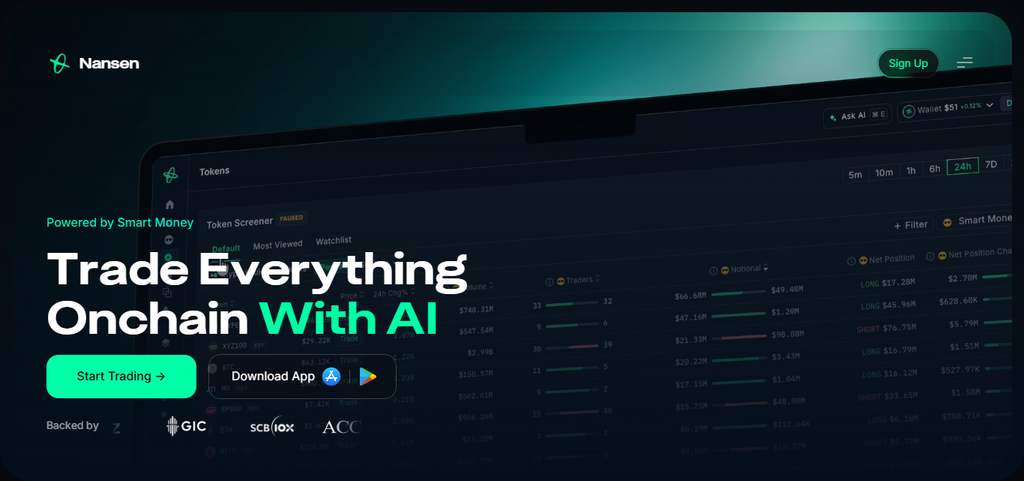
Nansen takes a more behavioral, wallet intelligence approach compared to Token Terminal’s financial approach. It is especially useful for analysts following capital flows, investor activity and blockchain adoption.
Nansen Features
| Feature | Explanation |
|---|---|
| Wallet Labeling | Identifies wallets associated with known entities and activities. |
| Smart Money Tracking | Monitors selected wallets to analyze notable investor movements. |
| Token Flow Analysis | Tracks token movements across supported blockchain networks. |
| Wallet Analytics | Examines wallet balances and transaction histories for on-chain research. |
8. Glassnode
Glassnode is an on-chain analytics platform that offers blockchain metrics and market indicators to understand cryptocurrency behavior. Its datasets may include exchange flows, realized capitalization, supply distribution, holder activity and other supported asset indicators.
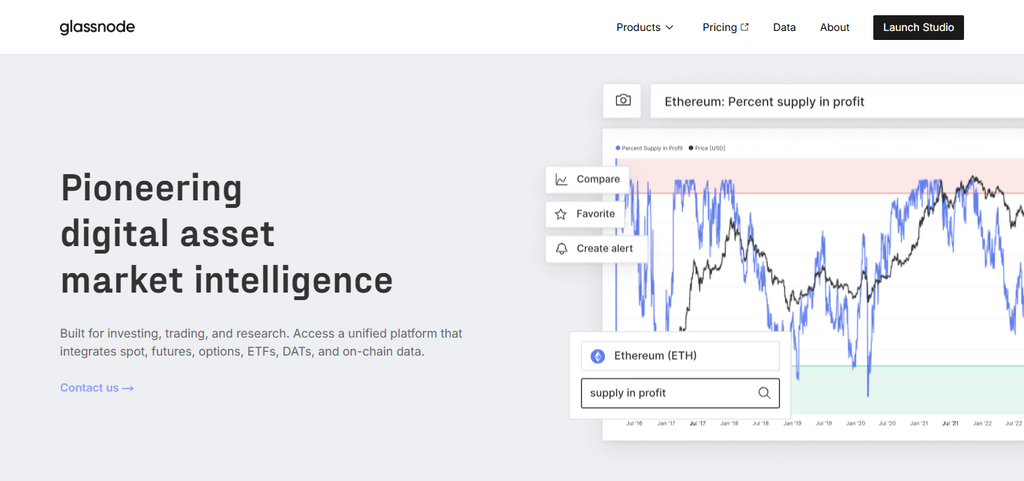
Investors use these measurements to analyze market cycles and changes in investor behavior, and to spot trends that are not easily seen on price charts alone. Glassnode offers good information for Bitcoin and other supported crypto assets . Metrics vary by subscription and network .
Glassnode is more focused on network economics and market behavior than on protocol financials like Token Terminal. Together, the two platforms can provide a better picture of protocol performance and sentiment among investors.
Glassnode Features
| Feature | Explanation |
|---|---|
| On-Chain Metrics | Provides blockchain indicators for evaluating network and market activity. |
| Exchange Flows | Tracks available asset movements to and from cryptocurrency exchanges. |
| Holder Analysis | Examines asset ownership and investor behavior through on-chain data. |
| Market Indicators | Provides metrics for studying cryptocurrency market cycles and trends. |
9. Coin Metrics
Coin Metrics is a provider of digital asset data that provides metrics for blockchain networks, market data and analytical tools for cryptocurrency research. Its datasets enable users to explore transaction activity, asset supply, network usage, market performance and other metrics across supported equities.
These metrics allow researchers and institutional investors to compare networks, look at historical trends and underpin fundamental analysis. Coin Metrics is another good resource for users who need structured datasets and consistent methodologies for quantitative research.
Token Terminal is more focused on protocol financial metrics, while Coin Metrics provides a broader set of network and market data. Data coverage, methodology and access depend on the specific product or subscription.
Coin Metrics Features
| Feature | Explanation |
|---|---|
| Network Data | Provides blockchain metrics for evaluating network activity and adoption. |
| Market Data | Supplies cryptocurrency market data for quantitative analysis. |
| Supply Metrics | Tracks asset supply information across supported digital assets. |
| Historical Datasets | Supports research using historical blockchain and market information. |
10. Santiment
Santiment is a cryptocurrency analytics platform that uses on-chain data, social activity and development indicators to help users research digital currencies. Tools can monitor wallet activity, token circulation, social discussion, developer contributions and more metrics for supported projects.
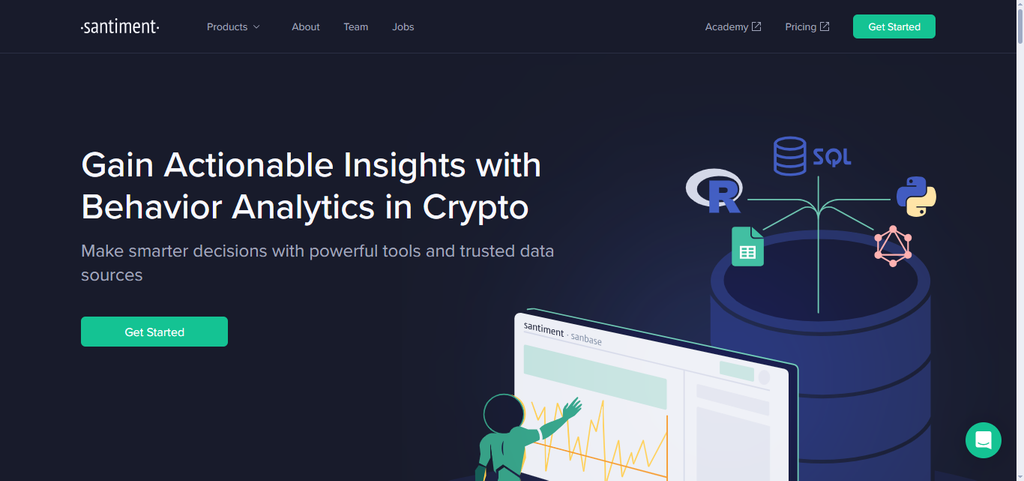
They allow analysts to see if community interest and development activity are keeping pace with market performance. An increase in social attention might suggest growing interest, but it doesn’t mean that a token’s price will necessarily increase. Token Terminal, in contrast, focuses on financial metrics, while Santiment provides additional context of sentiment and ecosystem engagement. It is useful for evaluating crypto protocols by merging fundamental research with behavioral signals.
Santiment Features
| Feature | Explanation |
|---|---|
| Social Sentiment | Analyzes social activity to understand cryptocurrency market discussions. |
| On-Chain Analytics | Tracks available blockchain metrics to evaluate project activity. |
| Development Activity | Monitors development-related indicators for supported crypto projects. |
| Whale Tracking | Helps analyze large wallet movements and token distribution patterns. |
Conclusion
Finally, the best protocol analysis tools such as Token Terminal come in handy for investors and researchers to evaluate blockchain projects with the help of financial metrics, on-chain data, tokenomics, and market trends.
It is also worth noting that platforms like DeFiLlama, Artemis, Dune Analytics, Messari and Nansen offer insights into protocol performance. The right tools help users understand crypto ecosystems, identify opportunities and make more informed investment decisions with data-driven research.
FAQ
DeFiLlama tracks total value locked, protocol fees, revenue, yields, and decentralized finance activity.
Yes, Artemis compares blockchain ecosystems using active addresses, transactions, fees, and network activity metrics.
Dune Analytics enables customized blockchain research through SQL queries, interactive dashboards, charts, and transaction analysis.
Token Unlocks tracks vesting schedules, upcoming token releases, circulating supply changes, and potential dilution risks.