

In this article, I will talk about the main competitors to Nansen including Arkham Intelligence, Dune Analytics, Glassnode, Token Terminal, DeFiLlama, CryptoQuant, Messari, Sentora, Santiment and Bubblemaps.
I will analyze the blockchain networks they cover, their analytics tools, pricing models, how quickly they update their data, if they provide APIs, and what their use case are. This will help you, the reader, understand the ins and outs of these competitor platforms.
Key Points & Top On-Chain Analytics Alternatives to Nansen
- Arkham Intelligence: Tracks blockchain wallets, entities, transactions, and on-chain activity through visual analytics.
- Dune Analytics: Provides customizable dashboards and SQL-based blockchain data analysis for crypto research.
- Glassnode: Delivers on-chain metrics, market indicators, and blockchain analytics for cryptocurrency investors.
- Token Terminal: Analyzes blockchain and crypto application fundamentals using financial performance metrics.
- DeFiLlama: Tracks DeFi protocols, total value locked, yields, fees, and blockchain ecosystem activity.
- CryptoQuant: Offers on-chain data, exchange flows, market indicators, and analytics for cryptocurrency markets.
- Messari: Provides crypto market intelligence, research, asset data, and fundamental blockchain analysis tools.
- Sentora: Provides blockchain intelligence, analytics, and data insights for understanding crypto market activity.
- Santiment: Monitors crypto social sentiment, on-chain activity, development metrics, and market behavior.
- Bubblemaps: Visualizes wallet relationships and token ownership clusters to uncover notable blockchain transaction patterns.
10 Top On-Chain Analytics Alternatives to Nansen
1. Arkham Intelligence
Arkham Intelligence is a blockchain intelligence service that primarily focuses on entity resolution. Arkham can tie blockchain addresses to entities, as well as trace transactions and holdings. The company currently tracks over 1 billion blockchain addresses across 16 different blockchains.
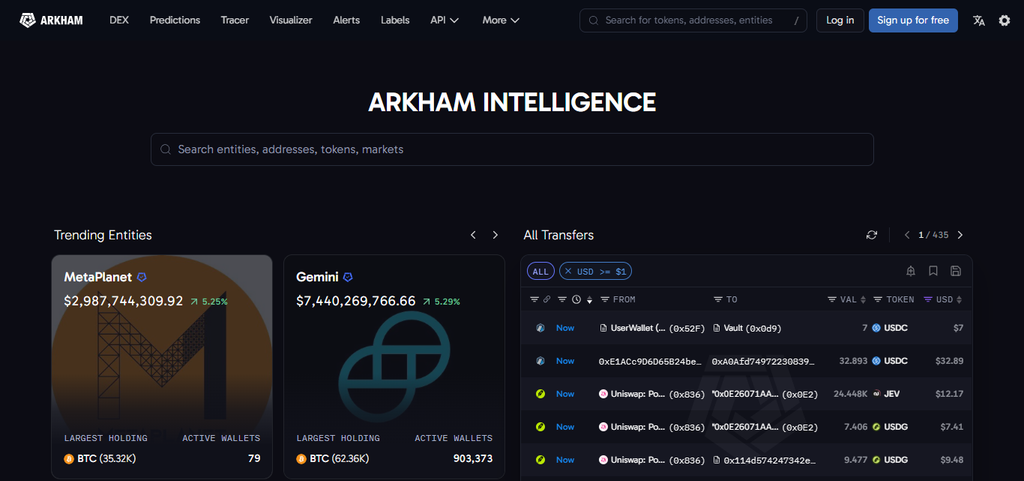
These blockchains include Ethereum, Bitcoin, and others. Arkham provides an API that allows users to find blockchain addresses, trace transactions, and assess the risk associated with an address.
For risk intelligence, users can integrate Arkham’s API with their own applications and label addresses with intelligence. Currently, the API is only available through Arkham’s developer’s site and includes authentication, rate limiting, and other controls.
Arkham Intelligence Features
- Wallet Tracking: Monitors blockchain wallets, balances, transactions, and activity.
- Entity Intelligence: Links blockchain addresses with identified entities and organizations.
- Visual Analytics: Maps relationships between wallets, transactions, and blockchain entities.
- On-Chain Investigation: Supports detailed research into transfers, holdings, and wallet movements.
| Pros | Cons |
|---|---|
| Entity-level intelligence with 1B+ labeled addresses across 16 chains | Not designed for SQL-style custom analytics like Dune |
| Strong address‑to‑entity attribution and fund‑flow tracking | Limited historical granularity compared to market‑focused platforms |
| Real-time API with entity labels, flows, and risk signals | Advanced features require paid developer access |
| Supports major chains: Ethereum, Bitcoin, Solana, Tron, Base, Arbitrum, BNB Chain | Less suited for protocol-level financial metrics |
2. Analytics
Dune Analytics provides blockchain intelligence, primarily through SQL. With SQL, users can create dashboards and datasets, and query blockchains.
Dune also provides blockchain intelligence through APIs. Dune covers a multitude of blockchain activity including, CEX and DEX activity, staking, lending, prediction markets, and others.
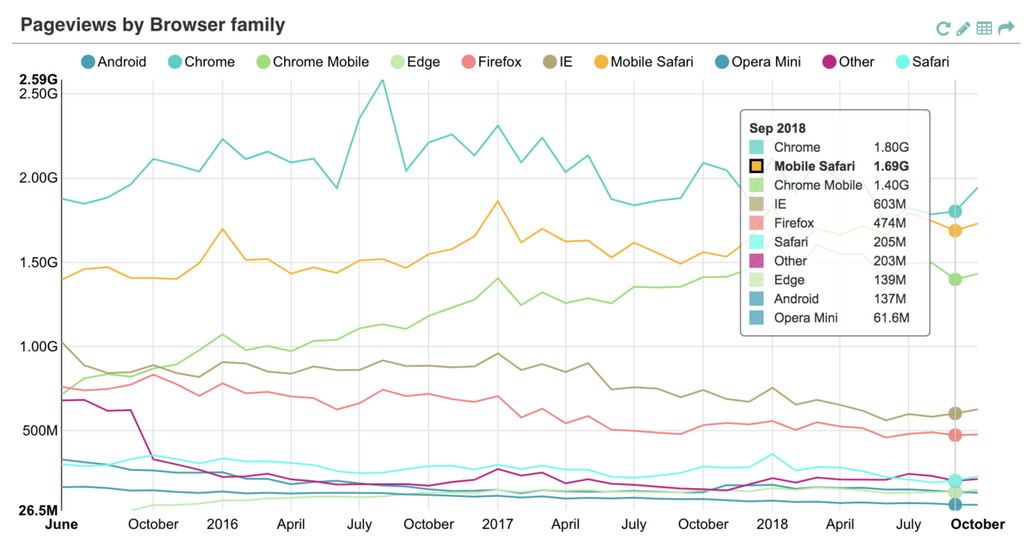
The intelligence is aggregated at the hourly and daily ranges. Dune’s exchange intelligence provides trading data over a time period of up to eight years.
Users can gain access to the intelligence through a variety of means including SQL, APIs, exports, and others. How Dune’s intelligence is used determines the pricing of the service. Higher usage and limits are provided through Dune’s enterprise plans.
Dune Analytics Features
- Custom Dashboards: Allows users to create personalized blockchain analytics dashboards.
- SQL Queries: Enables customized blockchain data analysis through SQL-based queries.
- Multi-Chain Data: Provides datasets covering numerous blockchain networks and ecosystems.
- Community Analytics: Offers dashboards and research created by blockchain data analysts.
| Pros | Cons |
|---|---|
| 130+ decoded chains and 1.5M+ datasets | Requires SQL knowledge for deeper insights |
| Highly customizable dashboards and queries | Data freshness varies (hourly/daily depending on dataset) |
| Multiple access modes: SQL, REST API, dbt, BI connectors | Enterprise features can be expensive |
| Excellent for protocol-level analytics and research | No native wallet‑entity attribution like Arkham |
3. Glassnode
Glassnode provides institutional investors with market and derivatives analytics. Its on-chain analytics cover 1,700+ time series metrics of over 1,500 assets. It captures blockchain data of 12+ blockchains. Its metrics cover various market activities, futures and options, and traditional financial markets.
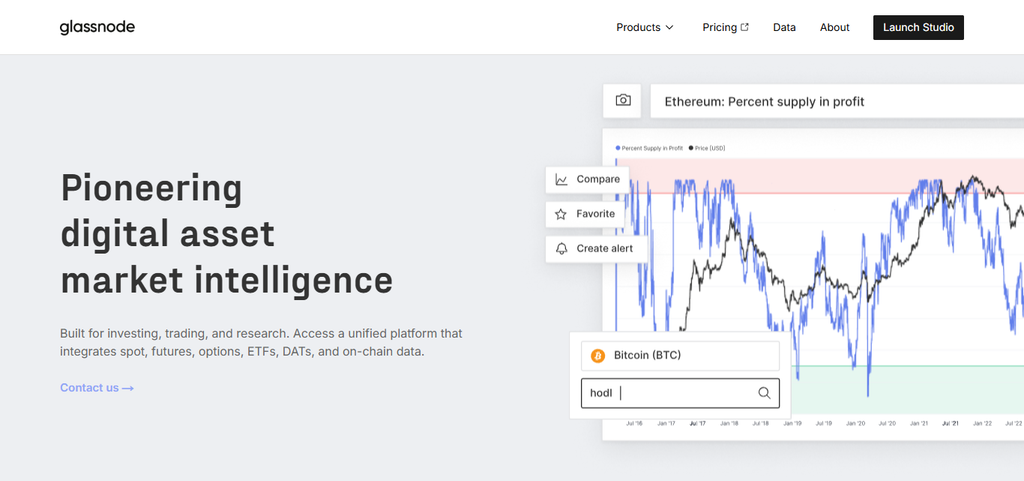
The data are available at the 1-hour, 6-hour, 1-day, and 7-day resolutions. The data can be accessed via APIs. The Advanced plan, which offers 1-year data history, is billed at $49/month. The Professional plan provides up to 10-minute data resolution and up to 15-years data history.
Glassnode Features
- On-Chain Metrics: Provides extensive metrics for analyzing cryptocurrency blockchain activity.
- Market Indicators: Combines blockchain data with market-focused analytical indicators.
- Historical Data: Supports analysis of historical cryptocurrency and network activity.
- Asset Research: Provides analytics for researching major cryptocurrency assets and markets.
| Pros | Cons |
|---|---|
| 1,700+ time-series metrics across 1,500+ assets | Wallet-level granularity is limited compared to Nansen/Arkham |
| Strong market, derivatives, ETF, and macro analytics | Professional plan required for high-resolution data |
| Supports BTC, ETH, Solana, Tron, BNB Chain, Arbitrum, TON, XRP | API access locked behind higher-tier plans |
| Up to 10-minute resolution and 15+ years of history | Focused more on market intelligence than DeFi protocol analytics |
4. Token Terminal
Like many competing services, Token Terminal provides more than wallet tracking and focuses on blockchain projects’ fundamental and financial analysis. It captures project’s business metrics and performance and helps users compare blockchain projects using conventional financial metrics.
Using its API, users can benchmark up to 250 projects. The Basic plan costs $3,250/year and provides a 7-day trial. It includes a token dataset, research support, and data and report format requests. The API customers can access data via REST, and Data Room customers can access data through BigQuery.
Token Terminal
- Financial Metrics: Tracks revenue, fees, earnings, and other protocol financial indicators.
- Fundamental Analysis: Helps evaluate blockchain applications using financial performance data.
- Protocol Comparisons: Enables comparisons between supported crypto applications and protocols.
- Standardized Data: Organizes financial information into comparable crypto market metrics.
| Pros | Cons |
|---|---|
| Standardized financial metrics: revenue, fees, earnings, users | Not focused on wallet-level analytics |
| API supports 250+ projects for programmatic benchmarking | Pro plan is expensive ($325/month) |
| BigQuery access for raw decoded multichain data | Custom pricing required for API/Data Room |
| Strong for comparing protocol fundamentals | Limited coverage of social or sentiment metrics |
5. DeFiLlama
DeFiLlama is one of the better tools to track DeFi-related activities across multiple blockchains and protocols. It includes data such as TVL, fees, revenues, volumes, addresses, yields, and other relevant data. Additionally, it has dashboards for a large number of blockchains.
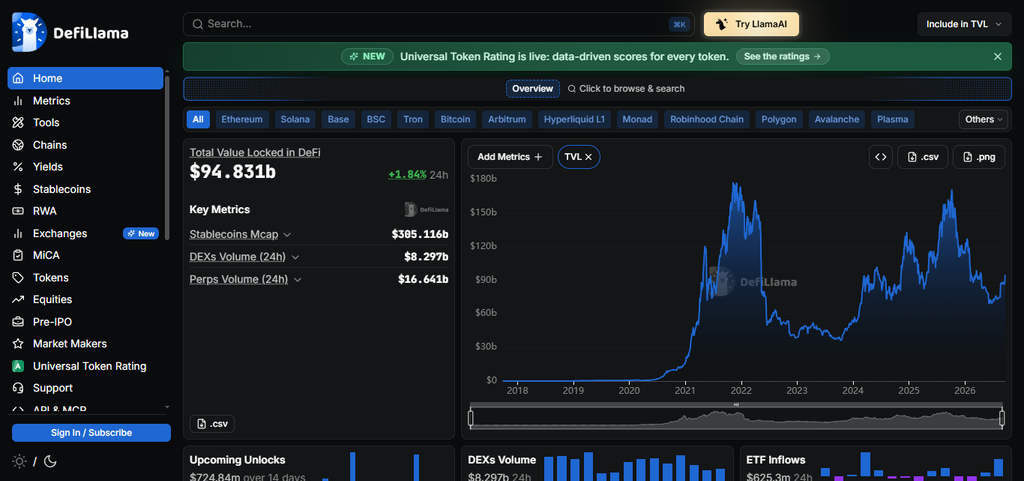
Data are presented for various time periods. It offers a free public version and an enterprise version with additional data access for a fee.
DeFiLlama Features
- TVL Tracking: Monitors total value locked across DeFi protocols and blockchains.
- Protocol Data: Tracks DeFi applications, protocols, chains, and ecosystem activity.
- Yield Analytics: Provides information about yields and available DeFi opportunities.
- Fee Tracking: Monitors protocol fees and related DeFi financial activity.
| Pros | Cons |
|---|---|
| Best free source for TVL, fees, revenue, DEX volume, stablecoins | Not designed for entity-level wallet intelligence |
| Covers hundreds of chains and thousands of protocols | Limited historical depth for some datasets |
| Free API and downloadable data | No advanced attribution or clustering analytics |
| Strong DeFi ecosystem monitoring | Enterprise features not publicly documented |
6. CryptoQuant
CryptoQuant offers a range of on-chain and market data. Some examples include reserves and flows of miners and exchanges. It also has data for various market activities. The basic plan includes 10,000 API requests per month for free. The advanced plan for $29/month offers 70,000 requests.
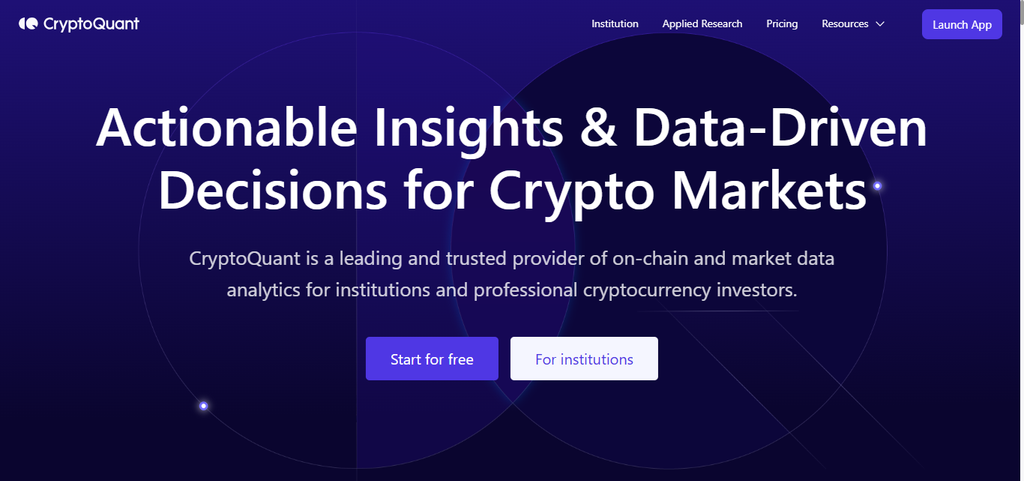
The professional plan for $99/month provides 200,000 requests, and the premium plan for $799/month offers unlimited requests. The professional and premium plans include on-chain API access. The data for all plans are for a limited time period.
CryptoQuant Features
- Exchange Flows: Tracks cryptocurrency movements involving centralized and decentralized exchanges.
- On-Chain Data: Provides blockchain metrics for analyzing cryptocurrency market activity.
- Market Indicators: Offers indicators covering exchange reserves and broader market conditions.
- Trading Analytics: Provides data useful for researching cryptocurrency trading behavior
| Pros | Cons |
|---|---|
| 200+ on-chain metrics across 490+ assets | Wallet-level clustering not supported |
| Strong exchange, miner, ETF, staking, mempool analytics | Premium plan ($799/month) required for full access |
| Free tier with 10,000 API credits | Some metrics have time lag depending on plan |
| Covers BTC, ETH, XRP, TRON, stablecoins, ERC‑20 | Less suited for DeFi protocol fundamentals |
7. Messari
Messari offers a variety of crypto-related data and services. Its application programming interface (API) includes structured data about different cryptocurrencies and the projects associated with them. The API also includes data about market activity and other information relevant to crypto.
The API includes an endpoint that provides information about over 1,000 different assets. The Messari platform also provides information and intelligence about different projects and markets.
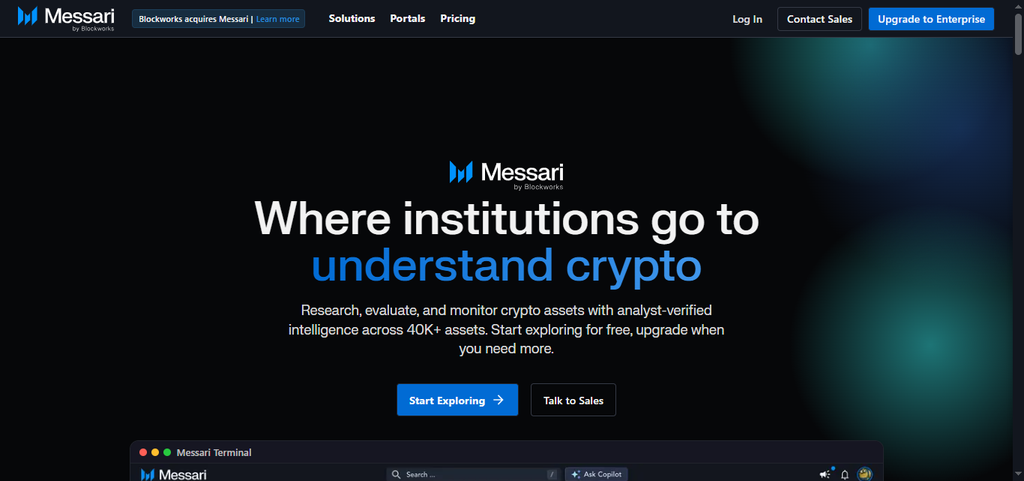
For this project, the most relevant information to compare with Nansen is research data and APIs, as well as the types of assets and the information provided about different tokens. Messari also charges for its data and APIs based on the product or subscription service.
Messari Features
- Market Intelligence: Provides research and data covering cryptocurrency markets and assets.
- Asset Data: Offers structured information about cryptocurrencies and blockchain projects.
- Fundamental Research: Supports analysis of protocols, networks, and crypto fundamentals.
- Research Reports: Provides detailed research covering different cryptocurrency sectors and projects.
| Pros | Cons |
|---|---|
| API includes 1,000+ structured asset records | Not focused on wallet-level analytics |
| Strong market intelligence, research, and project data | Some datasets require enterprise access |
| Good for token fundamentals, metadata, governance info | Limited real-time on-chain activity metrics |
| Multiple datasets across market, project, and ecosystem | Historical depth varies by subscription |
8. Sentora
Sentora provides blockchain and wallet-related data and analysis. It also provides intelligence and data about different blockchain ecosystems. When talking about Sentora, focus on the data it provides about various blockchain networks and the related wallets and addresses.
Mention the types of analyses and metrics it provides about different transactions and activities. Is the data provided by Sentora about wallets and transactions and related activities and metrics historical? Sentora provides an API for developers and institutional customers.
What types of data and metrics does the API provide? For how long does the data and the metrics related to the activities on the supported blockchains and the related ecosystems reflect reality? What types of fees does Sentora charge?
Sentora Features
- Blockchain Intelligence: Provides analytics for examining blockchain and crypto ecosystem activity.
- Market Data: Offers datasets and insights covering cryptocurrency market behavior.
- Network Analytics: Helps analyze activity and performance across supported blockchain ecosystems.
- Data Insights: Converts blockchain information into useful analytical market insights.
| Pros | Cons |
|---|---|
| Wallet analytics, protocol monitoring, and transaction insights | Exact chain coverage varies over time |
| Supports portfolio tracking and address activity dashboards | Public pricing not fully transparent |
| Offers historical and near-real-time data | API availability depends on enterprise tier |
| Good for ecosystem monitoring across multiple chains | Less documentation compared to larger platforms |
9. Santiment
Scores wider coverage than wallet analytics by including social and development data as well as on-chain data. As of now, Santiment’s catalog consists of 1,021 metrics and is trackable against 2,852 assets. Depending on the blockchain, metrics vary.
Currently supported blockchains are BTC, ETH, XRP, BNB, BCH, LTC, ADA, DOGE, and others. Some of Santiment’s data categories are social and development activities, financial data and of course, on-chain data. Their customer tiers determine access to real time data via their APIs. For unrestricted, real time data, customers would need Sanbase Max.
Santiment Features
- Social Sentiment: Tracks social discussions and sentiment surrounding cryptocurrency assets.
- On-Chain Activity: Monitors blockchain activity and cryptocurrency network behavior.
- Development Metrics: Tracks development activity associated with blockchain projects.
- Market Behavior: Combines social, development, and on-chain data for market analysis.
| Pros | Cons |
|---|---|
| 1,021 metrics and 2,852 supported assets | Real-time API requires Sanbase Max |
| Covers BTC, ETH, BNB, LTC, ADA, DOGE, ICP, Polygon, Avalanche | Some chains have limited metric availability |
| Strong social, development, and sentiment analytics | Less focused on wallet-level clustering |
| API available across subscription tiers | Data freshness varies by metric category |
10. Bubblemaps
Rather than providing data in a more traditional, numeric format, Bubblemaps focuses on visualizing data. Bubblemaps main attraction is showing how wallets are related to each other as well as how holders are related to each other and how tokens are related and/or distributed.
Their Visual mapping tool supports a growing number of blockchains. Their main attraction is providing visualizations of data rather than data themselves, so focusing on data freshness is not as valuable. Their main competitors are other blockchain data providers.
Bubblemaps Features
- Wallet Visualization: Displays relationships between token holders and blockchain wallets.
- Holder Clusters: Identifies potentially connected groups of token-holding addresses.
- Transaction Mapping: Visualizes notable connections and transaction relationships between wallets.
- Token Analysis: Helps investigate ownership distribution and wallet activity patterns.
| Pros | Cons |
|---|---|
| Unique wallet-cluster visualizations and holder mapping | Not designed for deep financial or market analytics |
| Supports BNB, ETH, Solana, Base, Tron, TON, Polygon, Avalanche, Aptos, Arbitrum | Limited historical depth compared to data warehouses |
| Great for detecting concentration, connected wallets, ownership patterns | Visual-first approach may lack granular numeric metrics |
| API + iFrame integration for embedding | Not suitable for multi-chain SQL-style research |
Conclusion
Conclusion Nansen’s competitors in the blockchain research and market data industry offer different products and services from Nansen. Arkham specializes in entity tracker, Dune specializes in query builder, Glassnode specializes in complex on-chain metrics, and DeFiLlama specializes in DeFi data tracker.
Other specialized products and services include CryptoQuant, Messari, Santiment, Token Terminal, Sentora, and Bubblemaps. The main variables used by consumers to evaluate alternative products and services are type of blockchain covered, metrics offered, pricing, timeliness of data, and type of API offered.
FAQ
Arkham Intelligence provides detailed wallet and entity tracking capabilities.
Dune offers free access alongside paid plans for advanced usage.
Glassnode analyzes on-chain, market, derivatives, and financial metrics.
DeFiLlama tracks TVL, yields, fees, volumes, and protocols.
CryptoQuant provides exchange flows, reserves, and market intelligence.