


In this article, I will review the best cryptocurrency analysis dashboards. First, we’ll cover dashboards designed for general on-chain activity. Next, we’ll review dashboards dedicated to DeFi analytics. Then, we’ll analyze dashboards for trade and market activity.
We’ll then review dashboards for blockchain performance. Lastly, we will review and compare each dashboard according to their key features. Our goal is to provide readers with an overview of the leading crypto analytics platforms.
Key Points & Best Crypto Analysis Dashboards Like Dune
- DeFiLlama: Tracks DeFi TVL, protocols, yields, fees, and blockchain activity across ecosystems.
- Token Terminal: Provides standardized financial metrics for analyzing crypto protocols and applications.
- Nansen: Combines blockchain data with wallet labels to reveal investor and market activity.
- Glassnode: Delivers on-chain metrics, market indicators, and analytics for crypto asset research.
- Arkham Intelligence: Tracks blockchain entities, wallets, transactions, and holdings through detailed on-chain intelligence.
- Artemis: Analyzes blockchain ecosystems using metrics covering users, developers, activity, and network performance.
- Messari: Offers crypto research, market intelligence, asset data, and comprehensive protocol analysis tools.
- CryptoQuant: Provides on-chain analytics, exchange flows, market indicators, and trading intelligence for cryptocurrencies.
- BubbleMaps: Visualizes token holder relationships to identify wallet clusters and potentially connected addresses.
- CoinGlass: Tracks derivatives data, funding rates, liquidations, open interest, and crypto market sentiment.
10 Best Crypto Analysis Dashboards like Dune
1. DeFiLlama
This website is a portal for tracking and analyzing data related to decentralized finance (DeFi). Like other platforms of its kind, it provides users with tools for evaluating data related to activities and trends related to money and finance (i.e. liquidity, fees, yields, etc.).
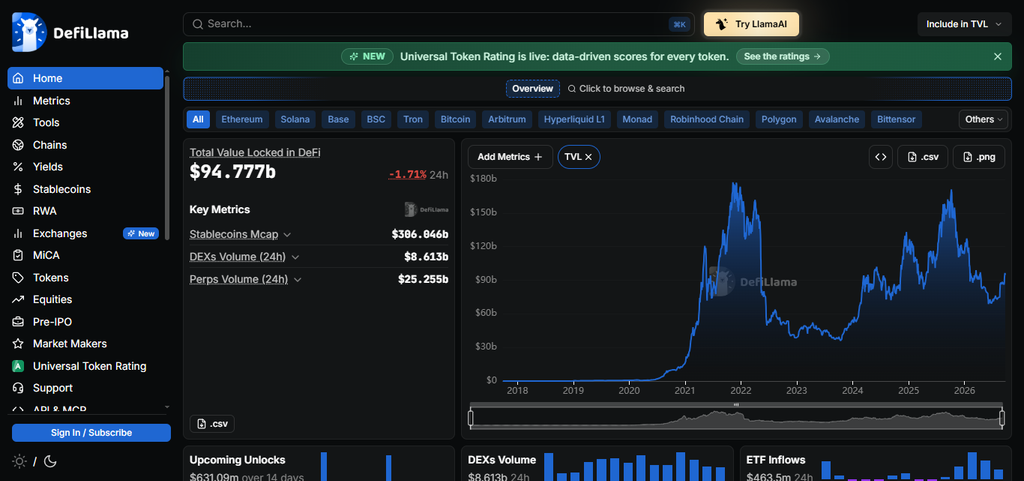
Unlike similar platforms, the purpose of DeFiLlama is more exploratory and less prescriptive. In other words, it is less focused on providing actionable data and more on facilitating the identification and definition of pertinent data sets. Thus, while DeFiLlama is valuable to the researcher and practitioner in the DeFi space, its primary value is educational and exploratory.
Pros
- Tracks TVL across numerous DeFi protocols and blockchain ecosystems.
- Provides data on yields, fees, protocols, and liquidity.
- Supports comparisons between different chains and DeFi sectors.
- Offers useful dashboards for monitoring changing DeFi activity.
Cons
- Large datasets can be difficult for beginners to interpret.
- Different metrics may use varying calculation methodologies.
- Individual metrics often require additional context for accurate analysis.
- Primarily focuses on DeFi rather than broader crypto analytics.
DeFiLlama Feature
| Feature | Explanation |
|---|---|
| Multi-Chain DeFi Tracking | Monitors DeFi activity across numerous blockchain networks and protocols. |
| TVL & Protocol Metrics | Tracks TVL, fees, revenue, DEX volumes, stablecoins, and yields. |
| Historical Analytics | Provides historical data for comparing liquidity and protocol growth. |
| Protocol Comparison | Helps users compare chains, protocols, categories, and DeFi ecosystems. |
2. Token Terminal
Token Terminal specializes in structures financial and other metrics in the blockchain space. Similar to DeFiLlama, Token Terminal allows users to assess various protocols in the blockchain space in a comparable and framework-oriented manner.
Therefore, the primary value proposition of Token Terminal is in the arena of financial and structural comparison of blockchain-based protocols. As such, Token Terminal is primarily targeted at the research and investing public.
Pros
- Standardizes financial metrics across supported crypto protocols.
- Provides revenue, fees, earnings, and financial performance data.
- Helps compare blockchain applications using financial indicators.
- Offers structured data suitable for fundamental protocol research.
Cons
- Coverage depth varies across different protocols and ecosystems.
- Financial terminology may be challenging for inexperienced users.
- Some advanced analytics require paid access or subscriptions.
- Financial metrics depend on available protocol-level data.
Token Terminal Feature
| Feature | Explanation |
|---|---|
| Financial Metrics | Tracks revenue, fees, users, transactions, and protocol financial performance. |
| Standardized Data | Presents comparable financial metrics across different crypto protocols. |
| Fundamental Analysis | Supports evaluation of blockchain applications through measurable business indicators. |
| Historical Performance | Allows users to analyze changes in protocol fundamentals over time. |
3. Nansen
Nansen uses blockchain data to analyze user interactions. It tracks and analyzes the ownership of certain assets and transactions. It provides information on crypto whales and provides insights on trading and investing. Labeled wallets provide insights on individuals (i.e. investors, funds, trading desks, etc.).
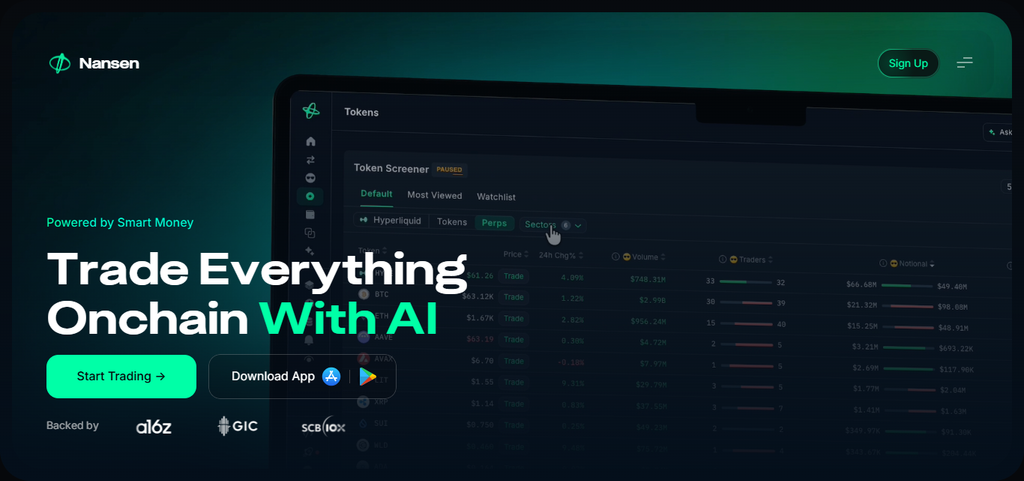
The application pulls data from numerous blockchains and provides historical and up-to-date data to help users analyze how users interact with smart contracts. Its core functionality is assessing how capital is moved and used to analyze strategic activity. It is used by investors and traders for research and analysis.
Pros
- Combines blockchain data with labeled wallet intelligence.
- Helps identify activity from notable wallets and investors.
- Provides detailed transaction and portfolio monitoring capabilities.
- Supports deeper research into on-chain investor behavior.
Cons
- Extensive datasets can create a steep learning curve.
- Advanced wallet intelligence may require paid access.
- Not every blockchain address receives an identifiable label.
- Wallet activity does not always reveal investor intentions.
Nansen Feature
| Feature | Explanation |
|---|---|
| Wallet Intelligence | Tracks wallet holdings, transactions, movements, and portfolio changes. |
| Smart-Money Tracking | Identifies and monitors activity from notable on-chain investors. |
| Wallet Labels | Connects blockchain addresses with known entities and investor categories. |
| Multi-Chain Analytics | Provides on-chain intelligence across multiple supported blockchain ecosystems. |
4. Glassnode
Glassnode is an analytics platform similar to Nansen. It also pulls blockchain data and provides insights for users to analyze interactions and user behavior. It provides data for the Exchange Rate Value of assets, the supply of an asset, and network activity.
It pulls data for several cryptocurrencies and provides users the ability to analyze data for different time periods to help users understand user behavior for different markets.
Glassnode’s primary function is to analyze and measure the activity of the crypto markets and provide users an edge when analyzing user behavior and market conditions. It is used primarily by investors and traders.
Pros
- Provides extensive on-chain metrics for cryptocurrency research.
- Combines blockchain activity with market-related indicators.
- Offers historical datasets for analyzing longer-term market behavior.
- Supports detailed research across major crypto assets.
Cons
- Advanced metrics require understanding of blockchain analytics.
- Some premium indicators require a paid subscription.
- Individual metrics can be misleading without broader context.
- Primarily focuses on digital assets and cryptocurrency markets.
Glassnode Feature
| Feature | Explanation |
|---|---|
| On-Chain Metrics | Tracks addresses, exchange balances, transfers, supply, and network activity. |
| Market Indicators | Combines blockchain data with cryptocurrency market performance indicators. |
| Investor Behavior | Helps analyze holder activity, supply movements, and market participation. |
| Historical Data | Provides long-term datasets for researching cryptocurrency market cycles. |
5. Arkham Intelligence
Arkham Intelligence offers blockchain intelligence across a spectrum of use cases, including entity resolution, wallet analysis, and transactional analysis. Arkham Intel explores financial transactions and interactions of entities within the blockchain ecosystem.
The solution’s unique selling point (USP) is the incorporation of labeled training data to blockchain entities and creation of a knowledge graph, thereby enabling users to automatically analyze relationships and interactions between wallets and other entities.
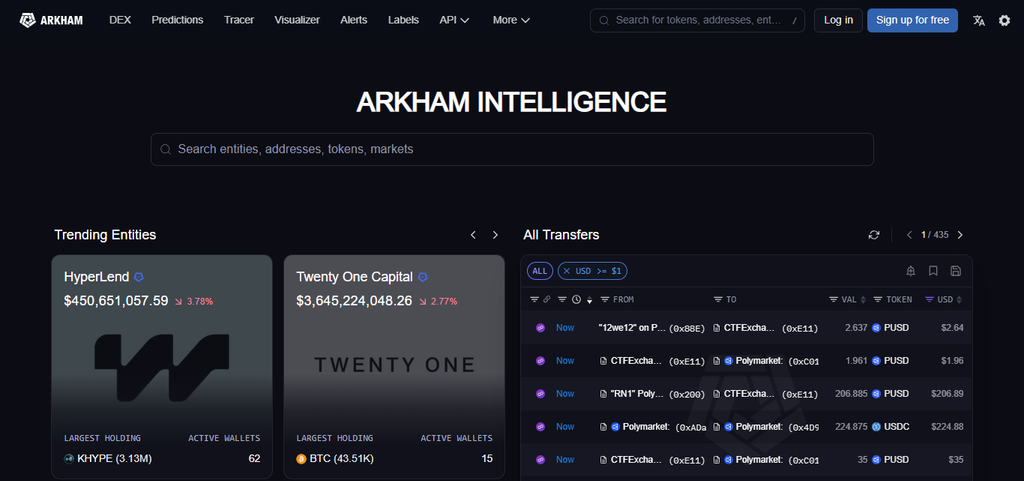
Currently, Arkham Intel supports multiple blockchain networks, and each supported network has transaction data that can be analyzed by users. The solution is used mainly to analyze wallets and transactions, especially large transactions. The solution is used by finance and investment professionals, as well as blockchain analysis firms.
Pros
- Connects blockchain addresses with identified entities and organizations.
- Provides detailed wallet, transaction, and holdings information.
- Helps investigate relationships between blockchain entities and addresses.
- Offers visual tools for exploring on-chain intelligence.
Cons
- Not every wallet can be reliably attributed to an entity.
- Detailed investigations may require significant blockchain knowledge.
- Transaction movements do not automatically explain underlying motivations.
- Entity coverage and labeling can vary between blockchains.
Arkham Intelligence Feature
| Feature | Explanation |
|---|---|
| Entity Intelligence | Links available blockchain addresses with identifiable entities and organizations. |
| Wallet Tracking | Monitors balances, holdings, transactions, and wallet activity. |
| Transaction Investigation | Helps investigate large transfers and movements between blockchain addresses. |
| Multi-Chain Coverage | Supports blockchain investigation across multiple cryptocurrency networks. |
6. Artemis
Artemis is a data and analytics solution that specializes in blockchain ecosystems, and offers various metrics such as on-chain and off-chain transactions, user behavior, and development activities. Artemis allows users to derive comparative insights and analysis across multiple blockchain networks.
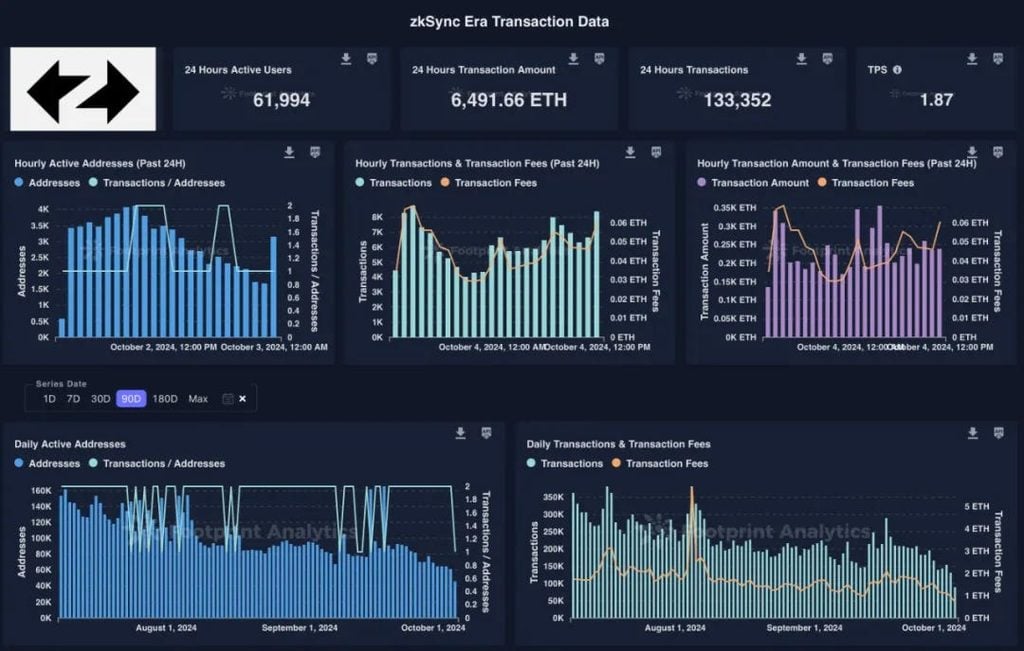
The solution offers historical and Retention Data to help users analyze and derive trends in blockchain network ecosystems. Artemis’s main use case is to evaluate, analyze and compare blockchain ecosystems. Artemis’s solution is mainly used by Blockchain protocol developers and researchers.
Pros
- Tracks users, developers, activity, and blockchain network metrics.
- Enables comparisons across different blockchain ecosystems.
- Provides useful insights into developer activity and ecosystem growth.
- Helps analyze broader network adoption and performance.
Cons
- Multiple metrics can be difficult to interpret correctly.
- Data availability varies across different blockchain ecosystems.
- Less focused on derivatives and exchange-flow analytics.
- New users may require time to understand its methodology.
Artemis Feature
| Feature | Explanation |
|---|---|
| Chain Comparisons | Compares blockchain networks using standardized ecosystem activity metrics. |
| Network Activity | Tracks active addresses, transactions, stablecoins, and related indicators. |
| Developer Metrics | Provides development-related data for evaluating blockchain ecosystem activity. |
| Historical Analysis | Helps identify ecosystem growth and changing network activity patterns. |
7. Messari
Messari offers a unified platform for market data, research, and project information for the crypto space. It covers a range of assets and protocols, as well as the research and data associated with different cryptographic networks. It provides structure to information and data that is often unstructured.
It supports the analysis of different assets and networks, and aids in assessing different blockchain projects. It primarily serves the purpose ofanalysis and research in the cryptocurrency space. It is a valuable resource for traders, researchers, analysts, and other users who want structured market and project data.
Pros
- Provides extensive cryptocurrency research and market intelligence.
- Covers assets, protocols, sectors, and broader crypto markets.
- Supports detailed analysis of individual blockchain projects.
- Combines research resources with structured crypto market data.
Cons
- Some advanced research features require paid access.
- Large amounts of information can overwhelm new users.
- Coverage depth differs between individual crypto assets.
- Advanced research requires familiarity with cryptocurrency markets.
Messari Feature
| Feature | Explanation |
|---|---|
| Crypto Market Data | Provides structured information about crypto assets and market activity. |
| Protocol Research | Covers protocol fundamentals, ecosystem developments, and project information. |
| Token Metrics | Tracks important asset-level and market-related cryptocurrency measurements. |
| Research Intelligence | Combines market datasets with research for broader crypto analysis. |
8. CryptoQuant
CryptoQuant provides on-chain and related market analytics. It focuses on exchanges, Bitcoin and major crypto assets. Its offerings include analysis of exchange inflows and outflows, reserves and flow tiers, miner transactions, on-chain activity and network conditions, order book and derivative profiles, and other market indicators.
Unique analytics enable users to track and assess movements of cryptocurrencies across various wallets and exchanges. Through its data sets and tools, users can also research and analyze historical market conditions, and derive and identify behavioral and cyclical trends.
The service is subscription-based. Its main use case is to analyze and research market conditions and on-chain activities. It is mainly targeted at traders and investors.
Pros
- Provides detailed cryptocurrency exchange-flow and on-chain data.
- Tracks exchange reserves, transfers, and market indicators.
- Offers analytics designed for cryptocurrency market research.
- Supports monitoring of changing exchange and blockchain activity.
Cons
- Strongly emphasizes trading and market-oriented analytics.
- Advanced indicators can require substantial analytical knowledge.
- Some advanced features require a paid subscription.
- Certain metrics depend on available exchange data
CryptoQuant Feature
| Feature | Explanation |
|---|---|
| Exchange Flow Tracking | Monitors cryptocurrency inflows, outflows, and exchange reserve movements. |
| On-Chain Analytics | Provides network, wallet, miner, and market-related blockchain metrics. |
| Market Signals | Helps analyze exchange activity and changing cryptocurrency market conditions. |
| Historical Comparisons | Enables users to compare current metrics with previous market periods. |
9. BubbleMaps
BubbleMaps helps understand token distributions and relationship between blockchain addresses. It creates visualization around token holdings, distributional wallets, address clusters, and addresses holdings. Using its analytics, users are able to visually represent relationships between wallets.
Often times, a single wallet may represent many addresses and vice versa. Relationships between wallets may be as a result of many transactions or share the same token holdings. Its coverage is determined by the tokens and blockchains supported by the platform.
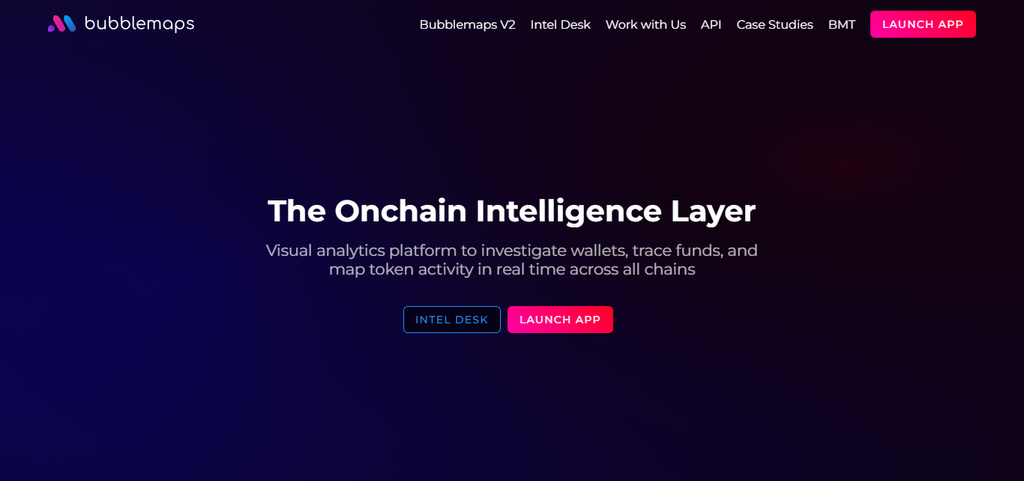
For analysis of historical data, users may review changes in wallet relationships and holdings. The main use case is analysis of token distributions, address relationships and wallets holdings. It is used by individuals in the finance and crypto industry for token research, trading and analysis.
Pros
- Visualizes relationships between token holders and wallets.
- Helps identify potentially connected wallet clusters.
- Makes complex holder relationships easier to investigate visually.
- Supports analysis of token distribution and wallet activity.
Cons
- Wallet connections do not necessarily prove common ownership.
- Focuses primarily on token-holder and wallet relationships.
- Large wallet networks can become visually complicated.
- Provides less comprehensive market and protocol-level analytics.
BubbleMaps Feature
| Feature | Explanation |
|---|---|
| Holder Visualization | Visually displays token ownership and distribution across blockchain addresses. |
| Wallet Clustering | Identifies connected wallet groups and relationships between addresses. |
| Ownership Analysis | Helps examine concentration among large token holders and addresses. |
| Token Due Diligence | Supports research into wallet connections and unusual ownership patterns. |
10. CoinGlass
CoinGlass focuses heavily on cryptocurrency derivatives and market-structure data. It tracks open interest, funding rates, liquidations, long-short ratios, futures activity, options information, and exchange-level derivatives metrics. Its unique analytics help users compare derivatives conditions across exchanges and monitor changes in leverage, positioning, and liquidation activity.
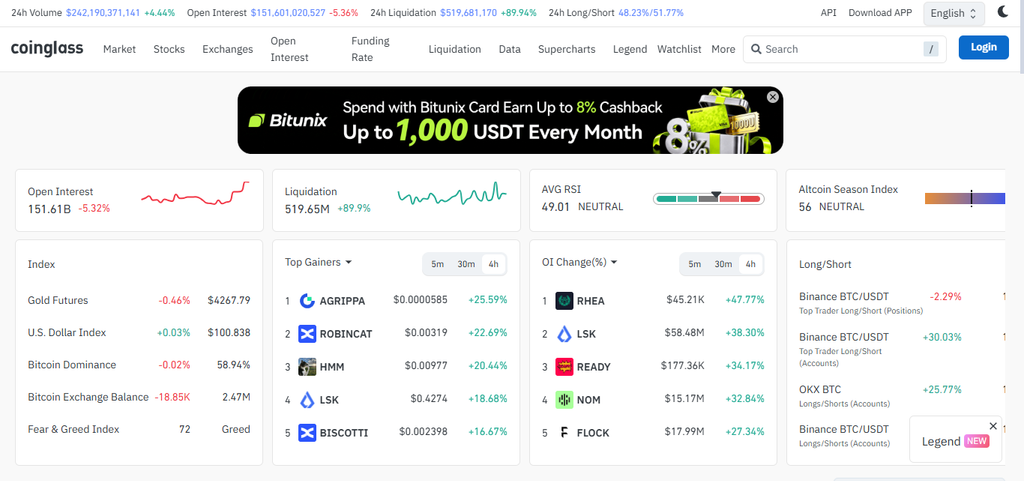
Historical data allows users to examine previous funding, open-interest, and liquidation patterns alongside current market conditions. The main use case is derivatives-market analysis and monitoring leverage-related activity across crypto exchanges. It benefits derivatives traders, market analysts, researchers, investors, and professionals studying futures, options, funding conditions, and broader crypto market structure.
Pros
- Tracks funding rates, open interest, and liquidations.
- Provides extensive cryptocurrency derivatives market information.
- Helps monitor futures activity across multiple exchanges.
- Useful for observing changing derivatives market conditions.
Cons
- Primarily focuses on derivatives and trading-related information.
- Advanced metrics require knowledge of derivatives markets.
- Rapid market changes can quickly alter displayed measurements.
- Offers less detailed wallet and protocol-level analysis.
CoinGlass Feature
| Feature | Explanation |
|---|---|
| Open Interest Data | Tracks open interest across cryptocurrency futures and derivatives markets. |
| Funding Rates | Monitors funding rates across supported cryptocurrency derivatives exchanges. |
| Liquidation Tracking | Displays liquidation activity to analyze leveraged market movements. |
| Derivatives Analytics | Covers futures, options, long-short ratios, and exchange-level derivatives data. |
Conclusion
In summary, the best crypto dashboards provide multiple pathways to analyze blockchains and the DeFi ecosystem. Users can analyze wallets, markets, derivatives, and other assets. There are numerous dashboards available such as DeFiLlama, Nansen, Glassnode, Arkham, and Messari, to name a few.
Deciding which dashboard best meets users’ needs often requires assessment of which metrics and blockchains are covered, as well as the extent of historical data and analysis provided by each dashboard.
FAQ
They help users analyze blockchain activity, transactions, protocols, and market data.
DeFiLlama provides extensive data for tracking DeFi protocols, TVL, and liquidity.
Nansen and Arkham provide tools for researching wallets, entities, and transactions.
CoinGlass offers data covering funding rates, liquidations, open interest, and derivatives.